Here you can find some of the data visualization created by me, mainly using the data from the #TidyTuesday challenge
Personal projects
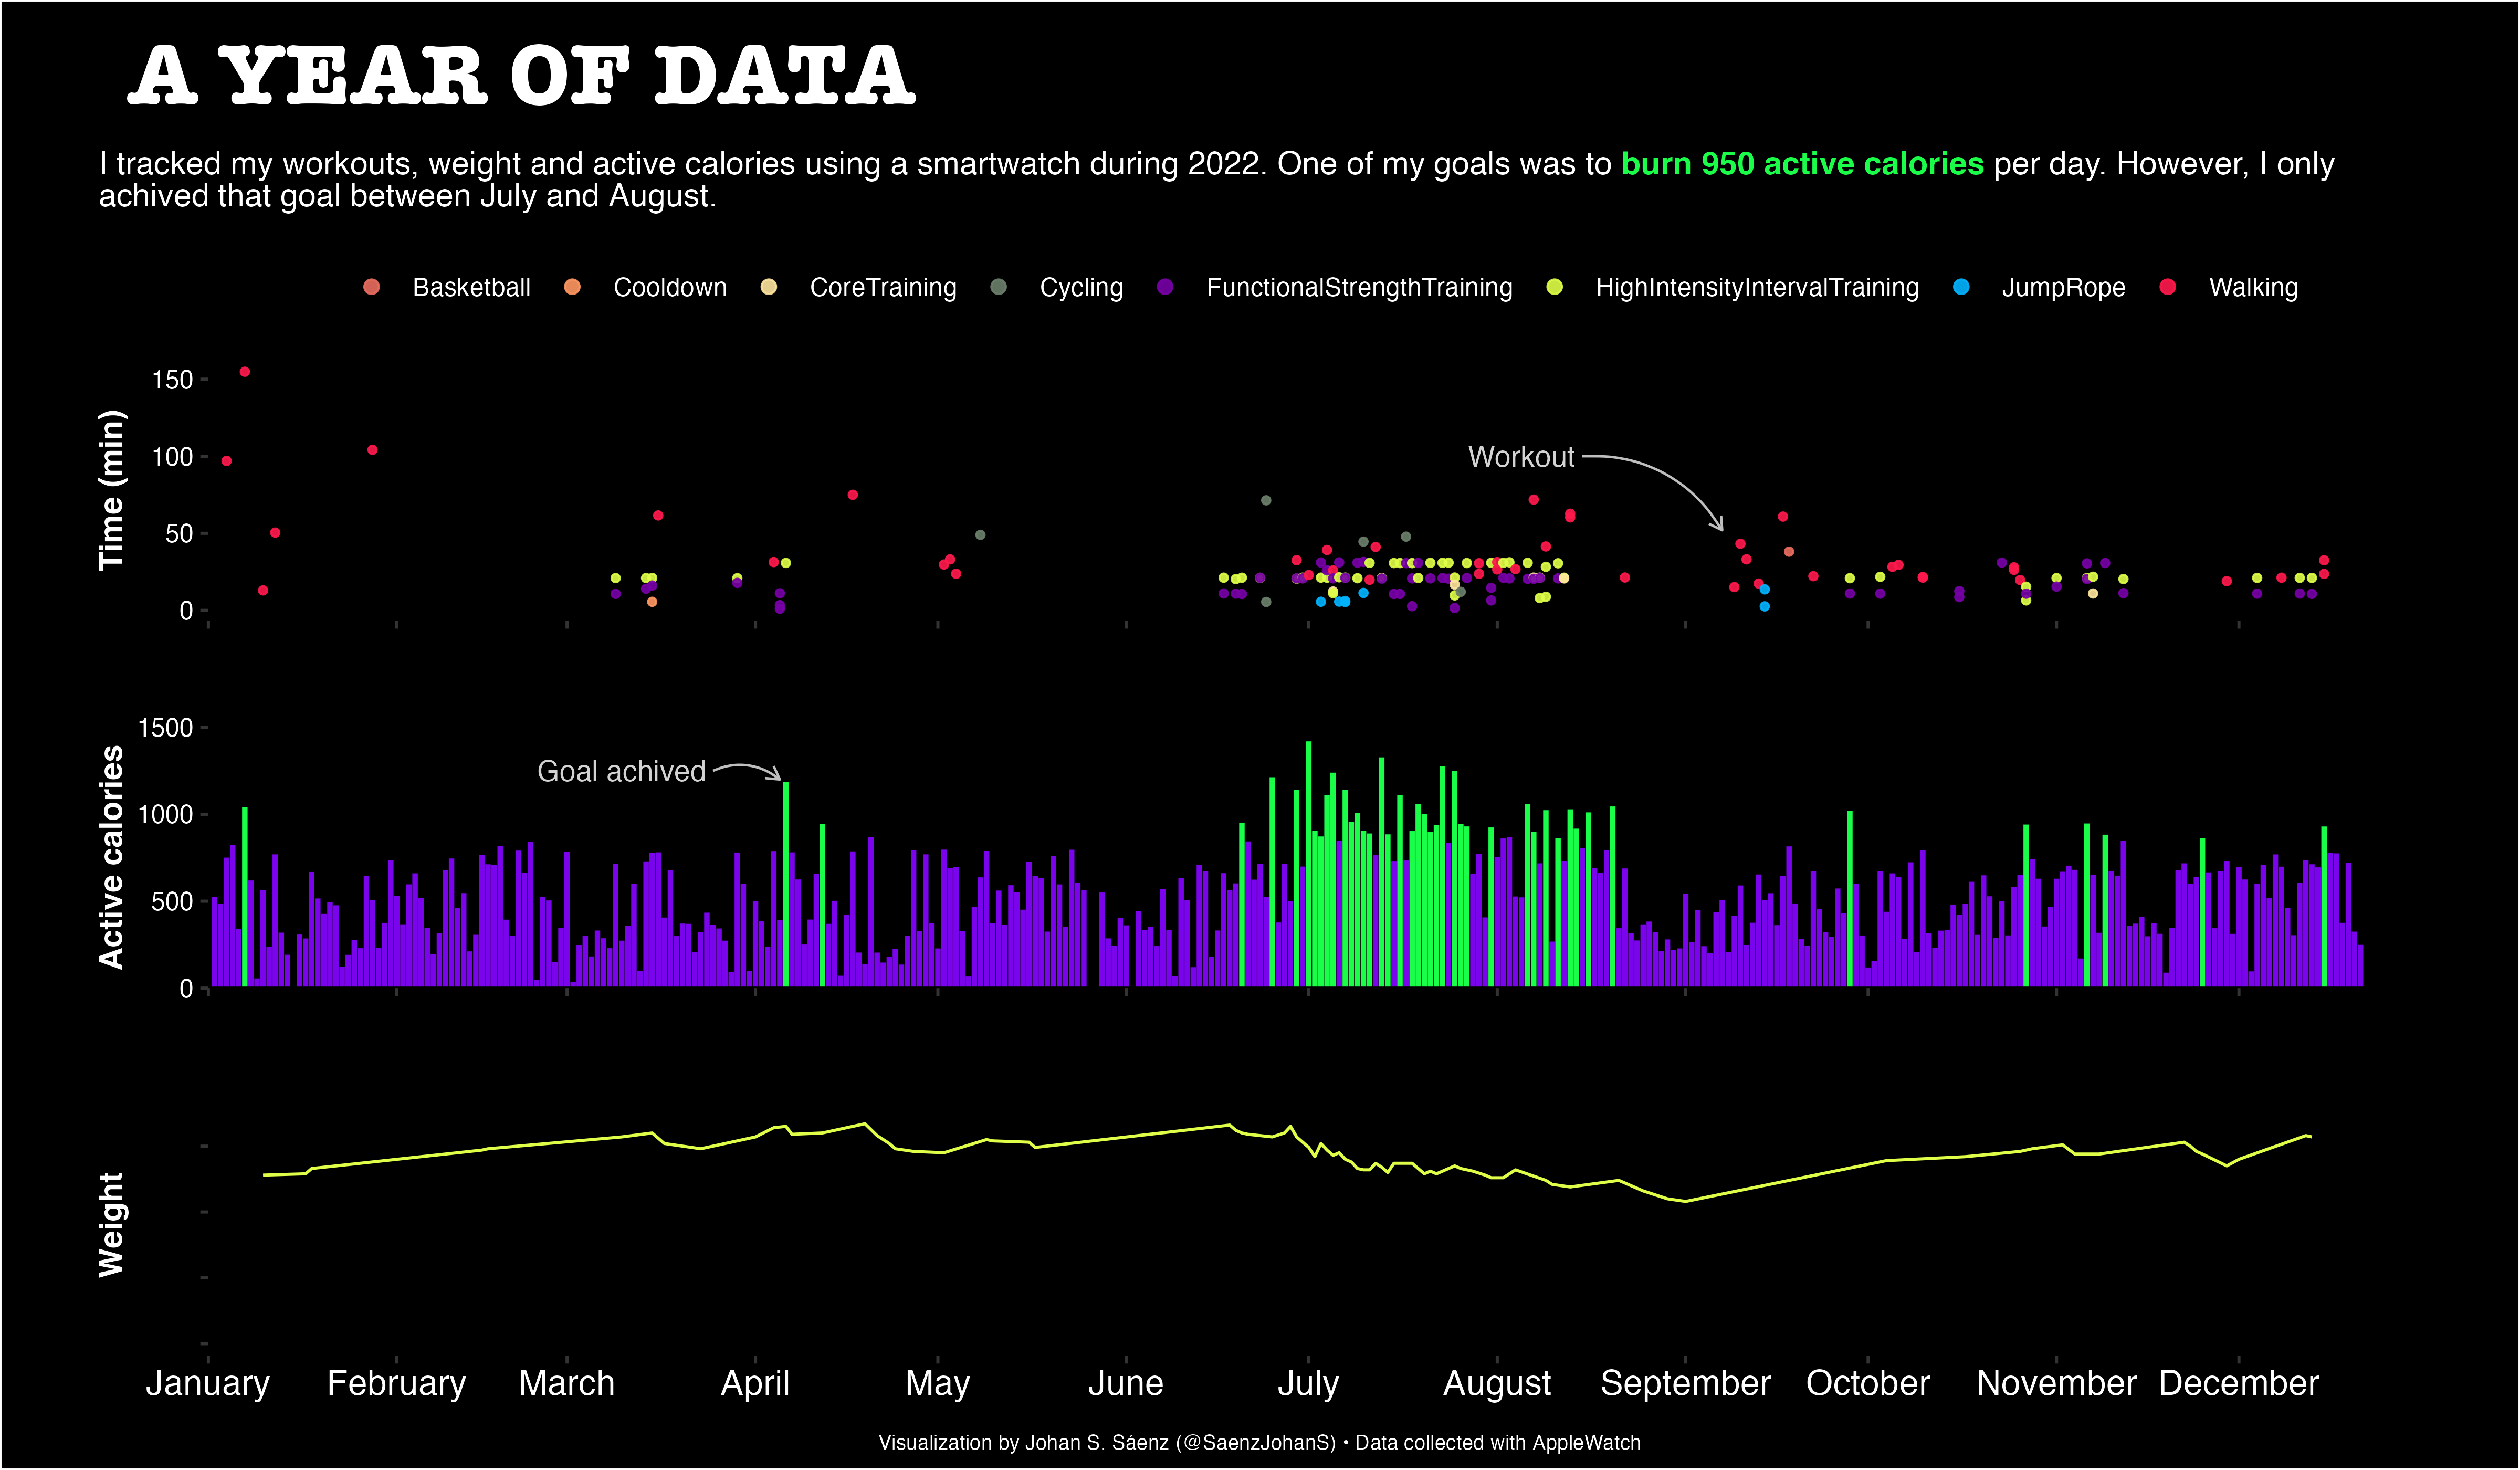
I want to analyse how active I am. I will collect daily data and update the plot at the beginning of every month.
This plot is the summary of my 2022

TidyTuesday
2022


2023
Tutorials